- Home
- Personal Injury
- PFAS Lawsuit
- PFAS Contamination Map
PFAS Contamination Map
- Last updated: March 17, 2026
-
 Contributor:
Sarah Miller
Contributor:
Sarah Miller

PFAS contamination has gained attention among both scientific communities and the general public, especially after studies found that these chemicals can be detected in the blood of 97 percent of Americans (Centers for Disease Control and Prevention). Because these substances do not break down easily and can accumulate in the body, many people want to know if their neighborhood or water supply is affected. One of the most direct ways to begin that search is by consulting a PFAS contamination map, which visualizes areas where PFAS has been detected.
We understand that interpreting these resources can be confusing. In this article, we examine how PFAS contamination maps are created, where to find them, and how to use them responsibly. We also look at any gaps or limitations so that you can make informed decisions about your health, property, and potential legal recourse.
If you discover that your area is affected by PFAS, you may have legal options. Many individuals and communities have already filed a PFAS lawsuit to seek compensation for health risks or property damage. Find out if you’re eligible—get a free case review and explore how Legal Claim Assistant can help you understand your rights and maximize any potential payout
Overview PFAS contamination map USA
- PFAS in Alabama
- PFAS in Alaska
- PFAS in Arizona
- PFAS in Arkansas
- PFAS in California
- PFAS in Colorado
- PFAS in Connecticut
- PFAS in Delaware
- PFAS in Florida
- PFAS in Georgia
- PFAS in Hawaii
- PFAS in Idaho
- PFAS in Illinois
- PFAS in Indiana
- PFAS in Iowa
- PFAS in Kansas
- PFAS in Kentucky
- PFAS in Louisiana
- PFAS in Maine
- PFAS in Maryland
- PFAS in Massachusetts
- PFAS in Michigan
- PFAS in Minnesota
- PFAS in Mississippi
- PFAS in Missouri
- PFAS in Montana
- PFAS in Nebraska
- PFAS in Nevada
- PFAS in New Hampshire
- PFAS in New Jersey
- PFAS in New Mexico
- PFAS in New York
- PFAS in North Carolina
- PFAS in North Dakota
- PFAS in Ohio
- PFAS in Oklahoma
- PFAS in Oregon
- PFAS in Pennsylvania
- PFAS in Rhode Island
- PFAS in South Carolina
- PFAS in South Dakota
- PFAS in Tennessee
- PFAS in Texas
- PFAS in Utah
- PFAS in Vermont
- PFAS in Virginia
- PFAS in Washington
- PFAS in West Virginia
- PFAS in Wisconsin
- PFAS in Wyoming
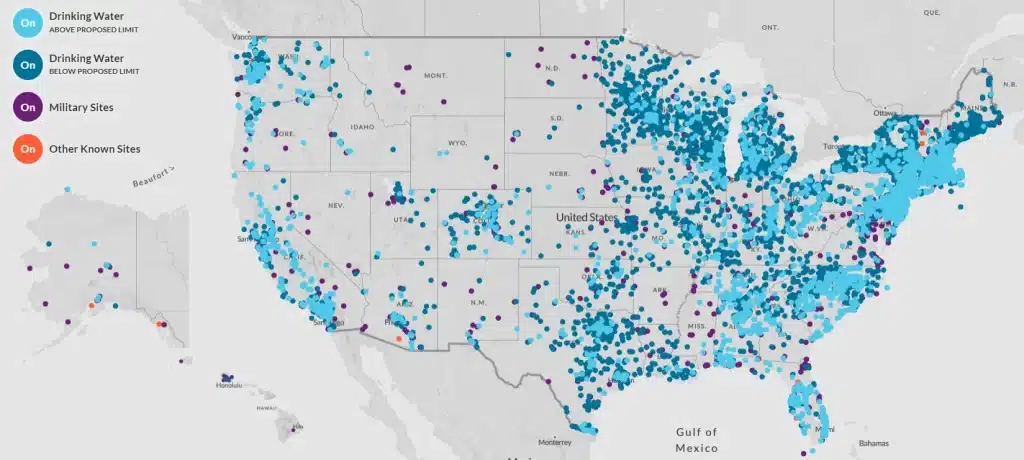
Across the United States, PFAS—short for per- and polyfluoroalkyl substances—have been traced in drinking water systems, soil, and air. According to the Environmental Protection Agency (EPA), thousands of sites nationwide have measurable PFAS levels, and new data from the Fifth Unregulated Contaminant Monitoring Rule (UCMR 5) indicate that more than 9,300 locations show signs of PFAS contamination. These include areas near industrial facilities, military bases, airports using firefighting foam, and landfills.
Because not all states have the same reporting requirements for PFAS, visualizing the true scope of PFAS contamination can be challenging. Different stakeholders—federal entities, state environmental agencies, universities, and nonprofit organizations—publish various maps to help citizens identify whether their community is potentially affected. While locations of known contamination are included, there are still gaps in data that can make these maps incomplete tools for assessing individual risk.
What is a PFAS contamination map?
A PFAS contamination map is typically a digital or printed resource that illustrates where PFAS has been detected and at what approximate levels. It can aggregate data from multiple sources, including federal monitoring programs, state environmental agencies, and academic studies. Some maps focus on drinking water systems, while others highlight industrial sites or areas where fish or wildlife have been assessed. Many rely on publicly available data, though some also incorporate private testing results or local monitoring projects.
Because PFAS can travel through soil and water, contamination is not limited to one specific region. The maps usually mark sites of known industrial production or disposal, along with water utilities that have reported PFAS levels surpassing certain thresholds. Though these resources can provide a broad overview, they do not always include every possible contamination point—private wells, smaller community water systems, or rural areas can be underrepresented.
What data sources are used to create these maps?
Most PFAS contamination maps in the United States draw on data from federal and state agencies:
- EPA monitoring programs: The EPA’s UCMR 5 is a frequent reference, as it requires certain public water systems to test for dozens of PFAS compounds. Past monitoring rules included fewer PFAS types, making older data more limited.
- State environmental agencies: Some states maintain robust databases of PFAS sampling in water utilities, surface water, or even wildlife. States like Michigan and New York have made these reports public to encourage research and community awareness.
- Centers for Disease Control and Prevention (CDC): Although the CDC’s expanded focus is on human blood levels of PFAS, their National Health and Nutrition Examination Survey (NHANES) can be used to correlate population-level data with regional factors.
- Academic research projects: Universities often partner with local governments to collect samples and analyze PFAS contamination in soil, sediment, or wells. These findings can be integrated into broader mapping initiatives.
- Nonprofit organizations: Groups focused on environmental advocacy may gather data from local testing initiatives or freedom-of-information requests. They sometimes create interactive tools where users can zoom in on a particular location and see available sampling results.
What are the most reliable PFAS maps available?
Reliability in PFAS mapping depends on several factors, including data freshness, sampling coverage, and the reputation of the organization compiling the map. Below are some of the more comprehensive sources:
- EPA’s UCMR 5 dashboard
This upcoming dashboard is expected to visualize updated information on PFAS detections nationwide, consolidating water sampling results from large and some small community systems. Users will be able to search by zip code or state. - State-level maps
Many state environmental agencies produce their own PFAS maps. Michigan’s Department of Environment, Great Lakes, and Energy (EGLE), for instance, maintains a public database with regularly updated results. Other states, like New York and New Hampshire, have interactive tools displaying both public water systems and private-well sampling data when available. - Academic or nonprofit resources
Several universities and research-focused nonprofits are leading the way in mapping PFAS hotspots. For example, the Environmental Working Group (EWG) has published maps using data from previous UCMR iterations and extended research. While some data may lag behind new findings, these maps can still reveal historical or ongoing patterns. - Local or utility-specific reports
In certain regions, local water utilities voluntarily post PFAS testing results online. Checking a city or county water department’s website can sometimes be the quickest method to confirm contamination levels in your immediate vicinity.
When consulting a PFAS contamination map, look at the publication date, which compounds were tested, and whether sampling methods are described. Recent, methodically sampled data can offer a clearer picture of your local exposure risk.
How to use the EPA’s PFAS contamination map
The EPA’s updated PFAS contamination map, tied to the UCMR 5 data, serves as a central platform for public water system testing results. Here are the basic steps:
- Navigate to the official EPA monitoring page. From there, find the PFAS section, typically labeled as UCMR 5 or PFAS drinking water data.
- Search by ZIP code or state. Many maps or dashboards allow you to filter by specific region.
- Review sampling results. The map typically indicates detected PFAS levels. Results may range from “not detected” to measurements in parts per trillion.
- Check detection limits and sampling dates. Sometimes, a PFAS compound goes undetected simply because the test method’s detection limit was higher than actual levels.
- Follow up with local agencies. If the map shows elevated PFAS in your area, consult your state environmental authority, local health department, or water utility for guidance.
As new data is reported, the map and dashboards are updated. It is advisable to set reminders to revisit these sites every few months, since PFAS levels can fluctuate based on new sampling or changes in local industrial activities.
State-by-state PFAS contamination resources
Because PFAS detection and public disclosure vary by jurisdiction, looking into state-level resources can often fill in the blanks left by federal monitoring. Some states, such as California, Michigan, and Minnesota, have strict PFAS guidelines and tend to publish extensive water quality data. Others may release partial summaries or rely heavily on federal thresholds.
Below is an example of how states might differ in their approach:
State | Primary Agency | Notable Tools or Data |
|---|---|---|
Michigan | Department of Environment, Great Lakes, and Energy (EGLE) | Interactive map of PFAS sites and private well sampling |
California | State Water Resources Control Board | GeoTracker GAMA, which includes PFAS data |
North Carolina | Department of Environmental Quality | Focus on industrial discharge data, local well testing |
If you reside in a state without a robust PFAS mapping program, you can still contact your county health office or search for university-led research projects in your region. Third-party platforms may also pool data to provide a more complete overview.
Are there maps for private wells or rural areas?
Private wells and rural community water systems are sometimes excluded from larger federal monitoring programs, especially those that focus on water utilities serving over 10,000 people. This creates a data gap.
Some nonprofits, state extension programs, and local advocacy groups coordinate well-testing initiatives in rural areas, then upload these findings into their own interactive maps. However, results can be sporadic and incomplete, depending on volunteer participation or available funding. If you use a private well and are concerned about PFAS exposure, consider:
- Checking state groundwater or private well databases if available.
- Contacting regional universities or local environmental nonprofits to see if they have testing programs.
- Hiring an accredited PFAS testing lab to check PFAS levels in well water.
Without centralized oversight or mandatory reporting, private-well owners are responsible for seeking out testing and interpreting results. You can also look into potential pfas remediation options, such as home-filtration systems, if tests confirm elevated PFAS.
What do the maps not tell you?
Even the most detailed PFAS contamination map has limitations. First, mapping data often reflects only a snapshot in time, showing concentrations from when the sampling occurred. Water sources, industrial processes, and usage patterns can change over months or years, making older readings less accurate.
Second, detection ranges might not include every PFAS compound. Thousands of different PFAS chemicals exist, but many tests look for a subset. Therefore, a particular compound might not appear on the map simply because it was never part of the testing regimen.
Third, maps cannot provide direct health risk assessments. While an area might show detectable PFAS, individual health risks depend on personal consumption rates, genetic factors, and other sources of exposure. For more comprehensive insights on health implications, you may want to consult pfas health effects and pfas in drinking water. Risk evaluations often require professional input from toxicologists or epidemiologists.
Can a PFAS map be used in legal or medical claims?
Many wonder if a PFAS contamination map can support lawsuits or medical claims. While it can serve as a starting point—showing that contamination exists in a given location—maps alone usually do not offer conclusive evidence of direct exposure or harm. Courts tend to require:
- Proof of exposure: Demonstrating that an individual consumed or otherwise encountered PFAS at levels sufficient to cause harm.
- Verified medical diagnosis: Linking a specific health condition to PFAS exposure based on credible scientific or clinical findings.
- Causation data: Showing that a known contamination source is responsible for the PFAS levels in question.
Because legal standards can be complex, many people work with specialized attorneys when building a PFAS lawsuit. Maps can guide early case research, but detailed testing and medical assessments are typically necessary to establish liability. Anyone considering litigation might also benefit from learning about pfas liability and reading more on established pfas and cancer or other health-impact cases.
What should I do if my area shows PFAS contamination?
If you consult a PFAS contamination map and see that your neighborhood or local water utility is flagged, there are several steps you can take:
- Verify test results
Review the actual sampling data if available. Check whether the detection levels exceed state or federal advisories. Some states set lower thresholds than federal guidelines. - Contact local authorities
Get in touch with your water utility, city council, or county health department to see if additional testing or mitigation efforts are planned. - Test your water
If you rely on a private well, consider contacting a certified pfas testing lab. Public water users can ask for recent water quality reports from the relevant utility. - Explore filtration options
If you find elevated PFAS levels, certified home water treatment methods may reduce your exposure. Resources like pfas water filter or pfoa water filter address specific contaminants. Other solutions include granular activated carbon and reverse osmosis units. - Seek professional advice
If you experience health issues possibly related to PFAS, consult a medical professional. You may also consider speaking with a lawyer about potential compensation or joining existing legal claims, such as those referenced at Legal Claim Assistant.
By taking these steps, you can better understand your personal exposure and explore possible remedies.
Frequently asked questions (FAQ)
We recognize that discovering your area may be affected by PFAS can be unsettling. Checking a PFAS contamination map is a logical first step. From there, verifying data, taking appropriate precautions, and seeking informed guidance can help safeguard your health and clarify whether legal remedies might be available.
They vary in accuracy depending on data quality and sample coverage. A map that reflects recent and methodologically consistent monitoring is generally more reliable. Still, the information might only show certain PFAS compounds or reflect past conditions.
Older maps can provide historical context but may fail to capture recent contamination or the introduction of new PFAS chemicals. Check whether the map has been updated in line with the latest EPA or state-level data.
You can look at federal resources, contact local environmental or health authorities, or explore nonprofit-led mapping projects. Sometimes local advocacy groups fill data gaps with citizen-led testing.
Several filtration methods exist, including do carbon filters remove pfas, pero not all systems are equally effective. Evaluate the product specifications, and consider professional guidance on pfas treatment technologies if levels are significantly high.
PFOA and PFOS are among the most studied and have been linked to health issues like immune system suppression. However, newer PFAS compounds also warrant caution, and research on their potential harms is ongoing.
Not necessarily. Legal claims generally require a direct link between exposure and health outcomes. If you suspect health effects, consult medical experts and consider reaching out to legal professionals. More investigative work is usually needed to demonstrate causation.
A PFAS lawsuit can take several months to years. Group claims or class actions may settle faster, while individual personal injury cases can take longer due to medical reviews and case complexity. On average, settlements may be paid 12–24 months after the claim is approved.
In one major case, DuPont paid $670.7 million to settle 3,550 lawsuits in Ohio. That averages about $189,000 per person, but amounts varied by health condition, exposure level, and supporting medical evidence.
What are the criteria to file a PFAS lawsuit?
You may qualify if:
You were exposed to PFAS after 1970
You drank contaminated tap water or used firefighting foam
You were diagnosed with a condition like kidney cancer, testicular cancer, bladder cancer, or thyroid disease
You can provide medical records and proof of exposure
The Environmental Protection Agency (EPA) recently set a strict limit of 4 parts per trillion (ppt) for PFOA and PFOS, two of the most harmful PFAS chemicals, in drinking water. Exceeding this limit may increase health risks, and could support a legal claim if exposure is proven.
Yes, veterans may be eligible for VA claims if their PFAS exposure happened during military service—especially if they worked with AFFF firefighting foam or were stationed at a contaminated military base. Benefits depend on your diagnosis and proof of exposure.
Speak to your doctor about blood testing for PFAS. While tests can’t show the exact amount of chemicals in your body over time, they may confirm PFAS exposure. Combine this with your medical records and exposure history to support a legal claim.
Related Article

Should I Get a Lawyer After a Drunk Driving Accident?